.png)
.png)
.png)
This was a redesign project where I led the end-to-end MVP design, rethought the user experience to address usability issues, conducted user testing with 30+ clinicians and patients, and pitched in 10+ investor meetings to drive early traction and validate core features.
Mental health conditions are often underdiagnosed and poorly managed due to complex symptoms and limited monitoring capabilities. NanoMood addresses this challenge through AI-powered, continuous symptom assessment using multimodal data.
Current mental health care relies on infrequent assessments, making it difficult to track patients’ progress, detect early warning signs, or tailor treatments effectively. Without continuous and user-friendly data collection, clinicians and patients are left with incomplete insights into day-to-day mental health patterns.
Developed an integrated system with two key components: a patient app for easy symptom tracking and visualization, and a physician dashboard with AI-powered tools for risk assessment and treatment planning.
How might we improve mental health care by designing intuitive tools that continuously collect and visualize multimodal symptom data to support more personalized and proactive treatment?
.png)
.png)

.gif)
.gif)
.gif)
To lay the foundation for NanoMood’s redesign, we conducted an in-depth research phase to understand both patients’ and clinicians’ pain points, needs, and goals. This included competitive benchmarking, a detailed audit of the existing product, and persona development—all of which shaped our design priorities.
We analyzed several leading platforms in the mental health and neuropsychiatric space to benchmark best practices and uncover opportunities for differentiation. The analysis focused on:
Usability: How well competitors facilitated real-time data input, monitoring, and reporting for users and healthcare professionals.
Features: Identifying standard and innovative features offered by competitors, such as multimodal data integration, AI-driven insights, and risk stratification tools.
Visual Appeal: Comparing visual design styles to evaluate trends, clarity, and how effectively they conveyed complex health information.
User Engagement: Studying techniques competitors used to retain user engagement, such as reminders, gamification, or personalized content.

Key Takeaways:
Feature Benchmarking: Real-time insights and mood tracking were standard; many used overly technical formats.
Visual Clarity Gaps: Most platforms used dense charts or raw data—hard for patients to understand.
Opportunity for Simplicity + Trust: NanoMood could stand out with more human-centered, plain-language explanations and friendly visuals.
.png)
To better define our core user types and needs, we created research-backed personas representing our primary stakeholders: patients and clinicians.
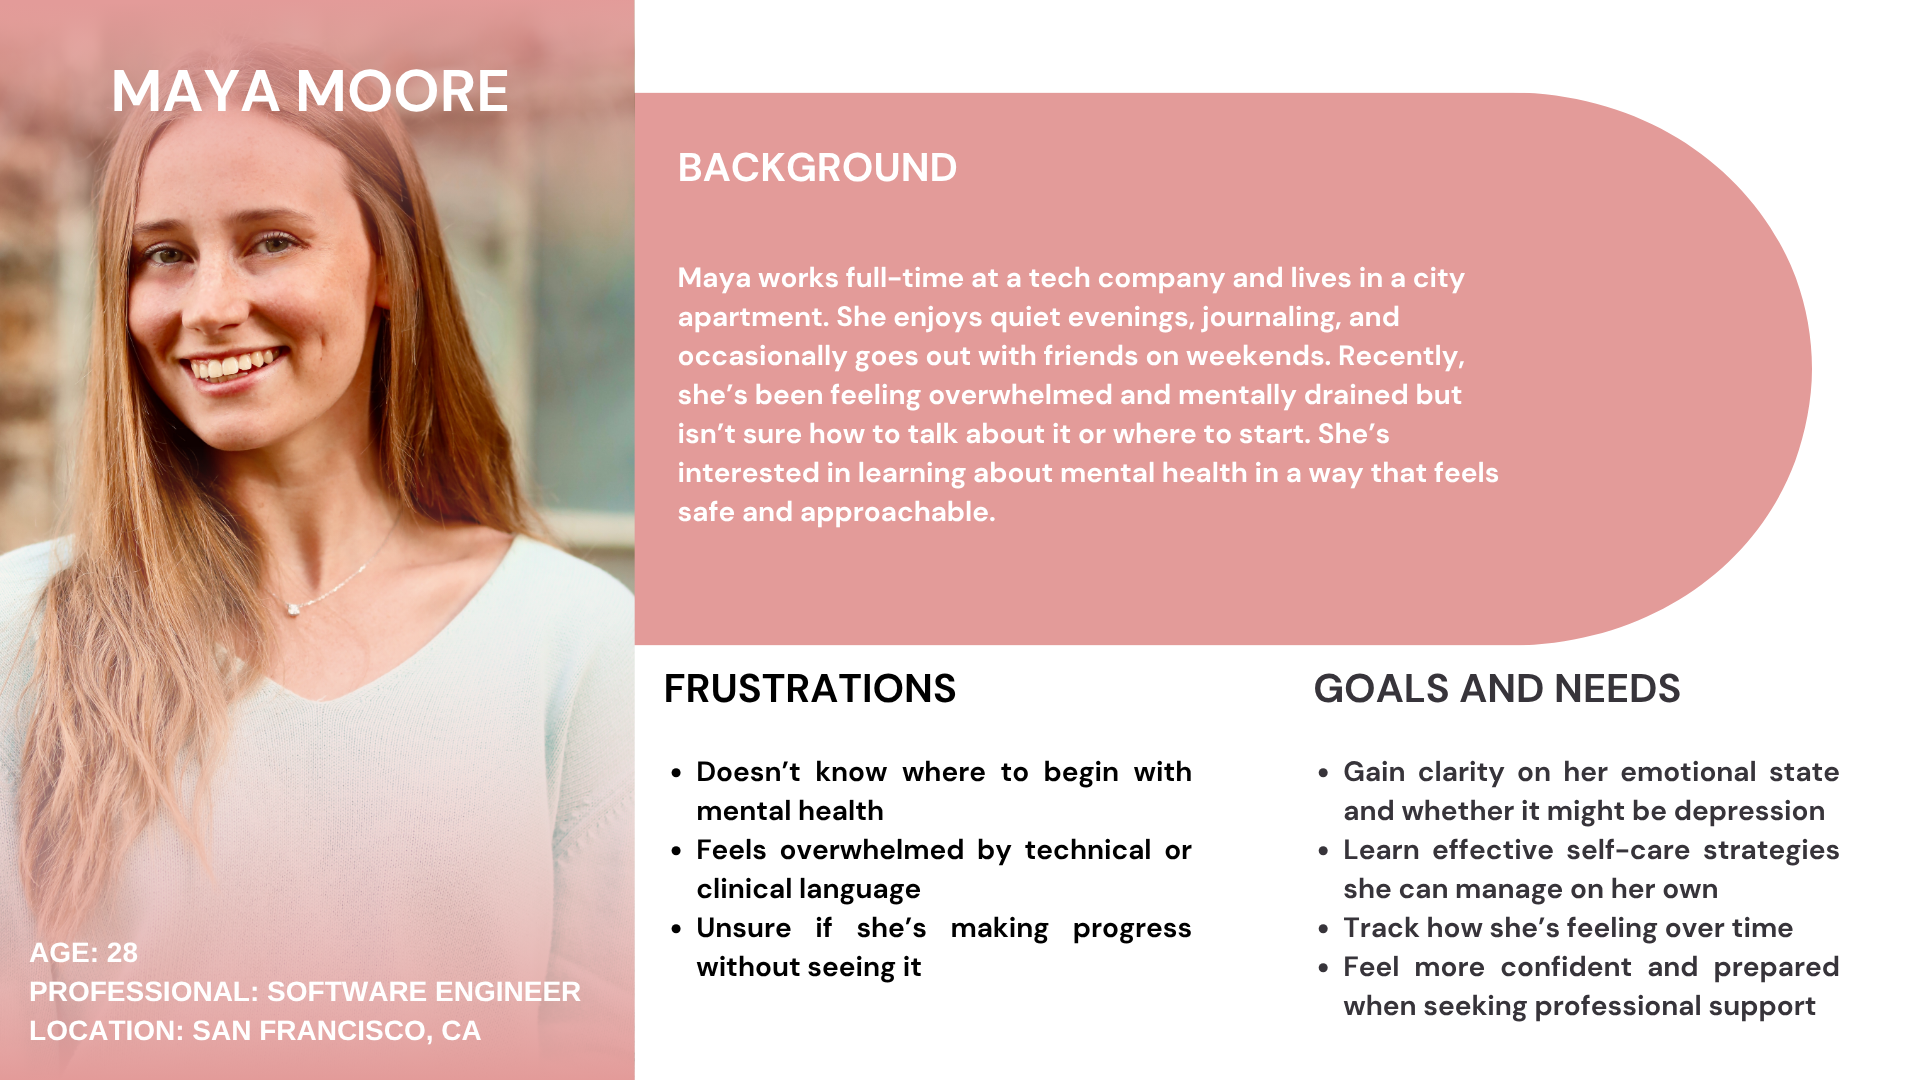

Key Takeaways:
Clarified Target Needs: Maya helped us emphasize clarity and comfort; Dr. Morgan emphasized efficiency and holistic visibility.
Kept Users at the Center: Personas served as design anchors in all key decision moment
Before:
The early version of the dashboard displayed a dense overview of patient data and graphs, but lacked a clear interaction flow. Features like filtering, note-taking, and session tracking were either missing or buried, making it harder for clinicians to act on insights efficiently.
Design Goal
We restructured the dashboard into a more task-oriented flow—separating patient filters, report access, and note management
.png)
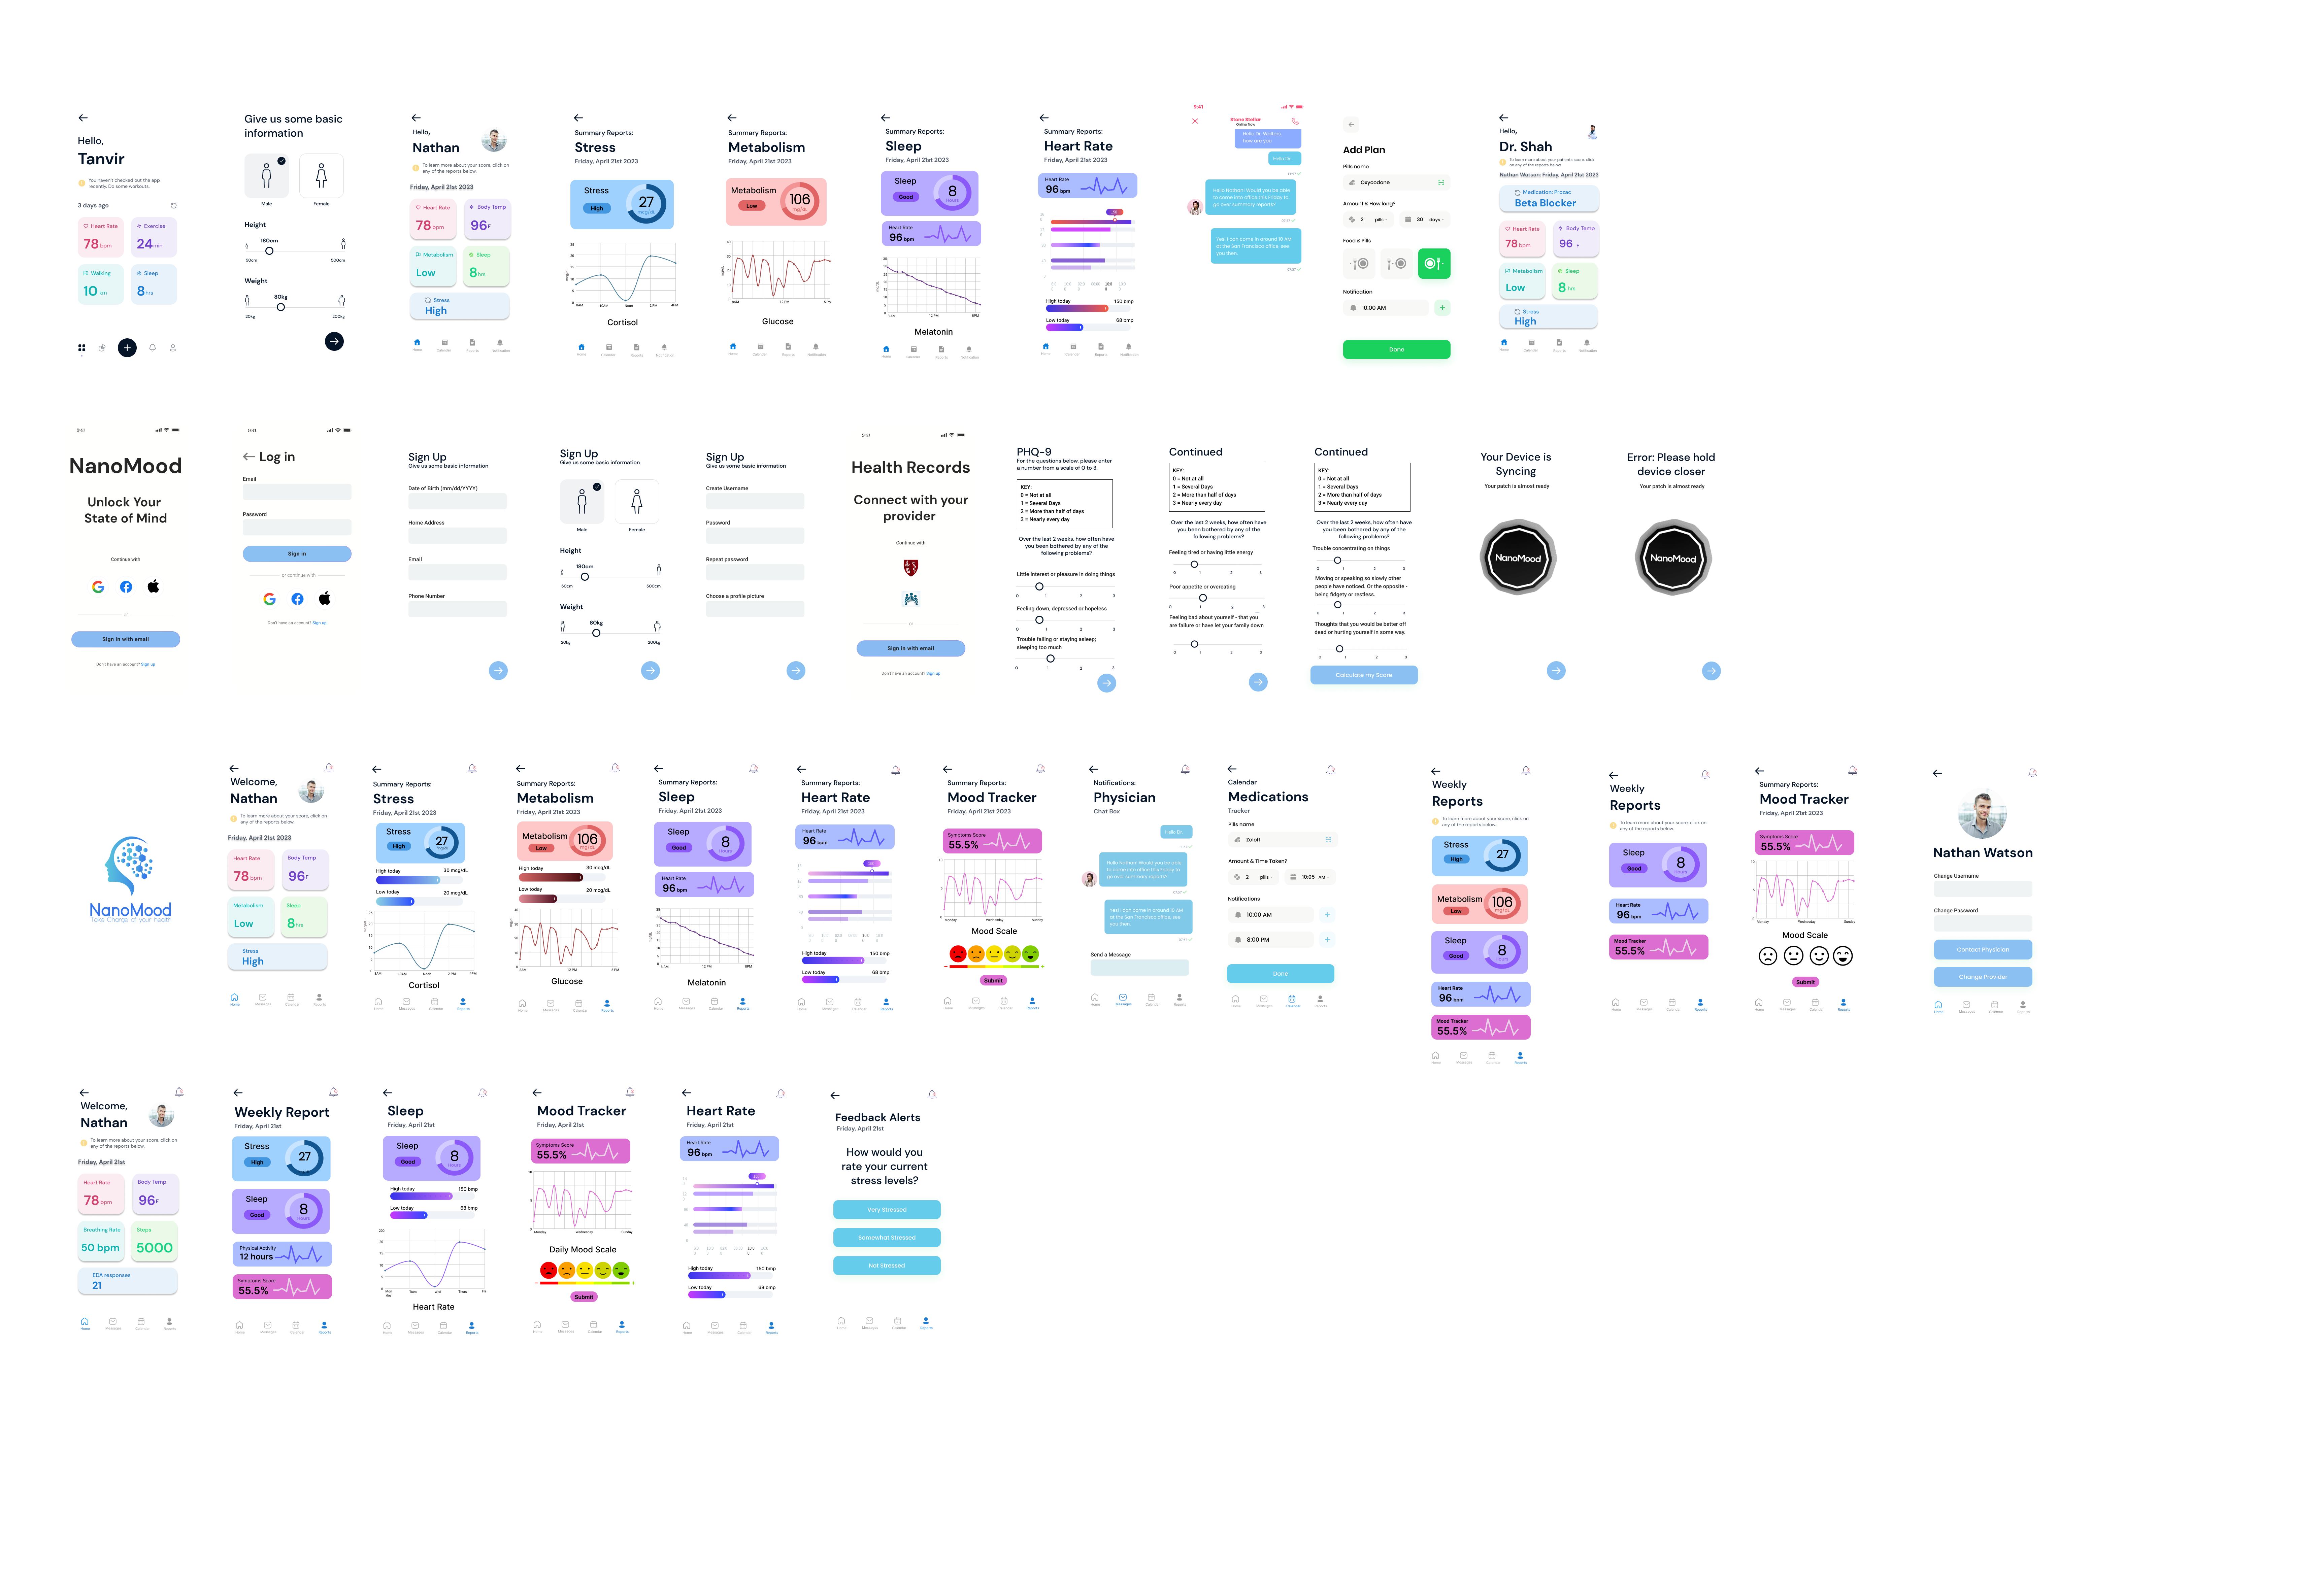
Before:
The early version of the app had a fragmented structure, with multiple screens dedicated to similar tasks. This led to a cluttered experience and unnecessary complexity for users navigating between repeated flows.
Design Goal
We streamlined the experience by consolidating overlapping screens, grouping related features, and simplifying the overall flow to reduce cognitive load and improve accessibility.
.png)
Participants & Sessions
Patients: We recruited ~10 UCSD students who owned wearable devices and were interested in mental health.
Clinicians: We conducted five 1:1 sessions with physicians from UCSD Health, and one larger session with over 10 clinicians led by our co-founders.
Testing Scope
We divided the user testing into three key flows for the patient platform:
1. Onboarding & Account Creation
2. AI Chatbot Interaction
3.Health Data Visualizations: Generated using LLMs developed by our machine learning engineering team to translate raw wearable data into personalized mental health insights
For clinicians, we walked them through:
1. A demo of both patient and clinician-facing dashboards
2. Key workflows like reviewing summaries, tracking medication response, and navigating patient insights
I personally conducted these sessions alongside another designer. While my teammate guided participants through the tasks, I asked follow-up questions, captured observations, and helped synthesize takeaways.
What We Measured
Problem 1 of 6: Onboarding was originally split across three separate screens.
Insight:
Observation: Users seemed frustrated by the multiple steps on each screen.
→During testing, participants hesitated and expressed that the process felt unnecessarily long. However, when tested with a consolidated version, no confusion or drop-off occurred.
Action Taken:
Added information icons beside each data input explaining its purpose and relevance to personalized insights.


Problem 2 of 6: Users didn’t understand what data they were sharing
Insight:
User: “Why do we need to upload this data?”
→ Users were confused about what information was being collected and why.
Action Taken:
Added information icons beside each data input explaining its purpose and relevance to personalized insights.

.png)
Problem 3 of 6: Complex graphs left users confused instead of informed.
Insight:
User: “These graphs are very complicated—I don’t even know how to read scatter plots.”
→ Users felt overwhelmed and couldn’t interpret the visualizations.
Action Taken:
Replaced scatter plots with simpler formats and introduced a “data interpretation” section summarizing key takeaways in plain language.
Problem 4 of 6: Lack of Real-Time Alerts
Insight:
User: “Can the app send a notification when it detects something unusual in my data?”
→ Patients wanted timely awareness of significant changes in their health metrics.
Action Taken:
Built a system for tagging/confirming events and added a notification flow to flag irregular biometric patterns.

Problem 5 or 6: AI Mislabeling or Missing Events
Insight:
Clinician: “Sometimes the metric data can detect a false event or miss an episode, i think there should be some sort of feature for patients to confirm these episodes and add any missed episodes”
→ Clinicians emphasized the need for more accurate episode logging.
Action Taken:
Enabled patients to confirm, deny, or tag health events before AI-generated interpretations are finalized.
Problem 6 of 6: Switching Between Tools During Sessions
Insight:
Clinician: “Most clinicians use separate note-taking software—switching mid-session would be a barrier.”
→ Workflow interruptions were a major concern for clinicians.
Action Taken:
Added a built-in note-taking feature in the clinician platform to streamline workflow and reduce app-switching.
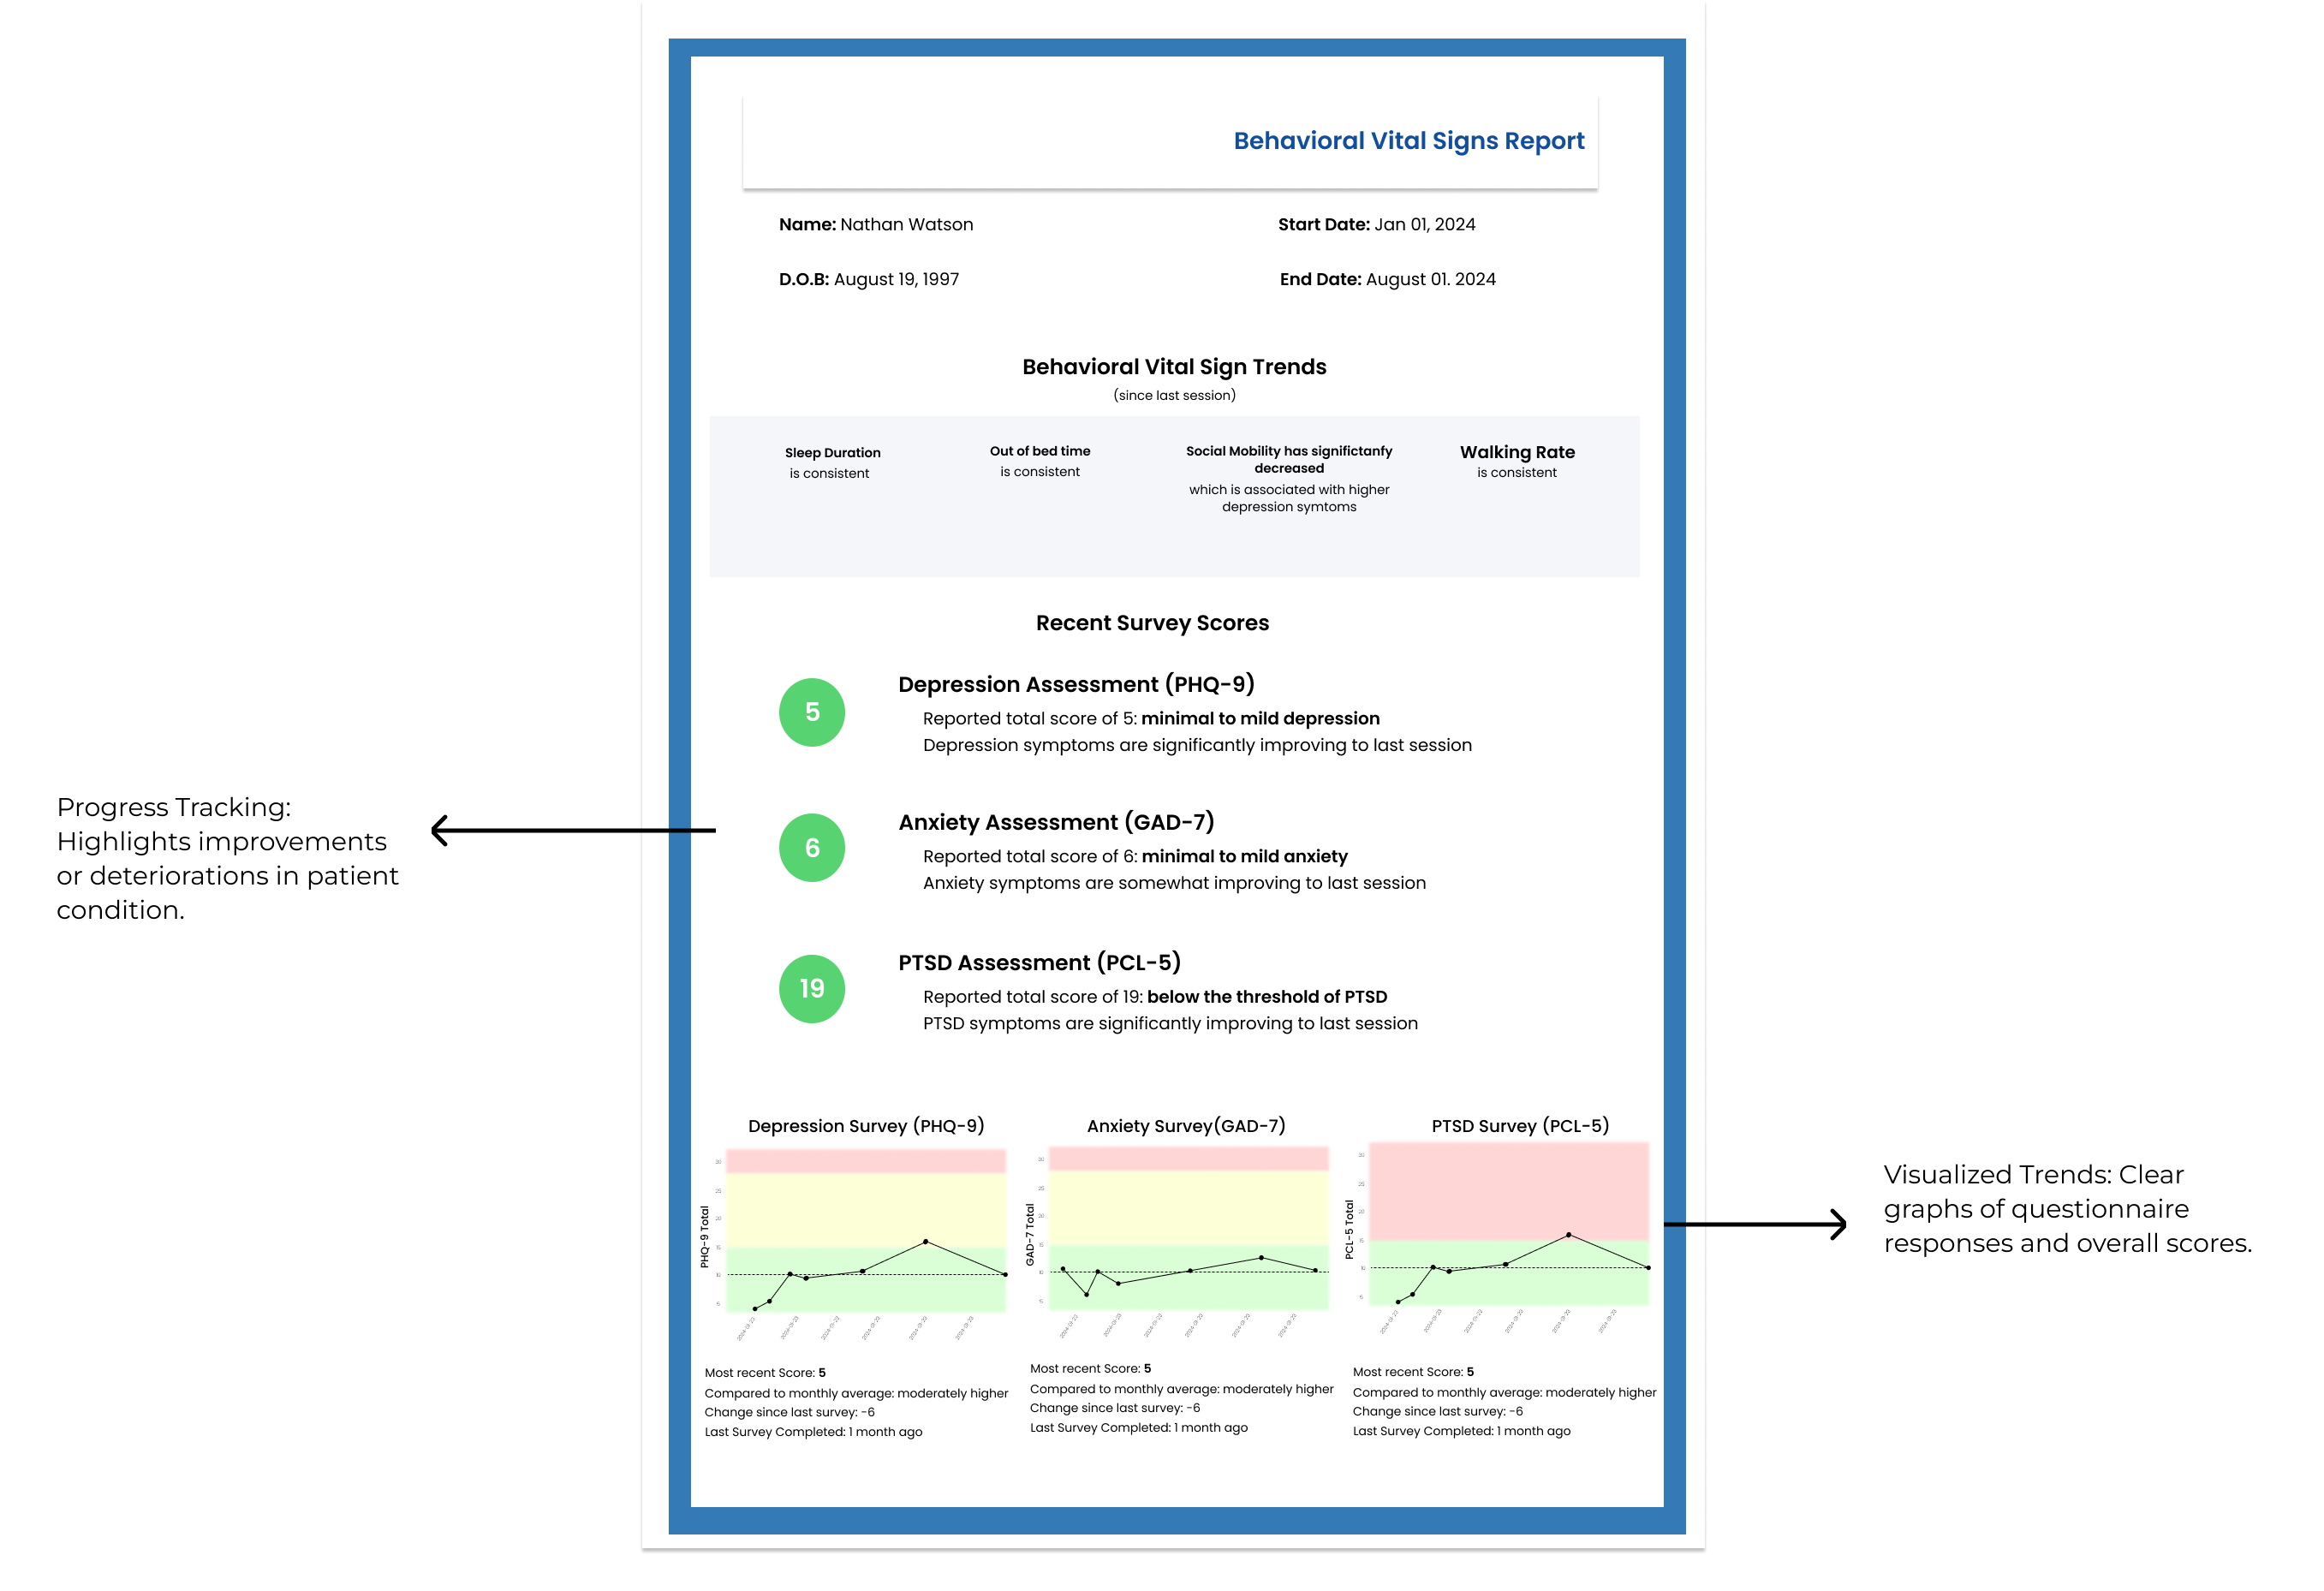
Clear Progress Tracking:
Clinician: “I like that it shows pre- and post-medication comparisons.”
→ Clinicians appreciated how the app helps visualize treatment impact and improves session quality by providing a holistic view of patient progress.
Seamless Chatbot Experience:
→ Patients interacted with the chatbot naturally, without confusion, making it easy to share concerns in their own words.
Empowering Mental Health Understanding
Patient Insight:
→ Many users shared that the platform helped them better understand patterns in their own mental health and made it easier to express their experiences and concerns.
Clinician Insight:
→ Multiple clinicians noted that the app’s summaries and visualizations could support more productive sessions and offer a more holistic view of each patient’s mental health journey.
.png)

.png)
.png)
.png)
.png)
.png)
.png)